Affordability in the Washington DC Region: The Growing Burden of Housing Plus Transportation Costs
By Lisa A. Sturtevant, PhD

The Washington DC region’s high housing costs have been well-documented. But it can be particularly difficult to find affordable housing close to transit and transportation options or near growing employment centers. Many individuals and families feel compelled to look further out to find housing they can afford. While there is some evidence of a rethinking of the “drive ‘til you qualify” philosophy, many households in the Washington region don’t see another option when facing high housing cost in the region’s most accessible neighborhoods. But while it’s possible to find lower cost housing in some of the region’s suburban neighborhoods, households often face substantially higher transportation costs which can lead to an overall higher housing plus transportation cost burden.
Many low- and moderate-income households across the region—and throughout the country—face significant challenges in affording the combined costs of housing plus transportation. Transportation costs are the second largest share of an average household’s budget, after housing. However, unlike housing expenses, which are paid on a monthly basis in the form of rent or mortgage, transportation costs are spread out over time, which makes it more difficult to track them or to account for them in decisions about where to live. As a result, many households do not take into account transportation costs when searching for lower-priced housing they can afford. Fully accounting for taking transportation costs is important for assessing the region’s affordability challenges and working towards solutions. A recent report by the Texas A&M Transportation Institute found the Washington DC had the worst traffic congestion among all major U.S. metro areas.
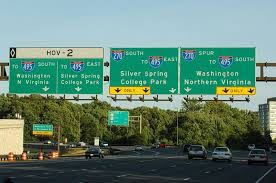
The average commuter spent 67 hours per year in a traffic delay, six hours more than Los Angeles and San Francisco, which tied for the second worst traffic congestion. And with new housing construction picking up in the more distant suburbs with little transit access, the region’s commuters may be faced with even longer drives to work in the years to come. If—or when—gas prices rise in the future, the total cost of commuting could become a growing share of households’ budgets, and will disproportionately affect low- and moderate-income working households.
Location Affordability – The Combination of Housing and Transportation Costs
A household’s transportation costs vary considerably across the Washington DC region and depend on the neighborhood’s proximity of jobs and transit and transportation options, as well as households’ commuting and travel behaviors. The U.S. departments of Housing and Urban Development and Transportation, along with the Environmental Protection Agency, created an online tool called the Location Affordability Index (LAI) which lets you look at average housing and transportation costs for different household types defined by household size and income. The tool allows for the comparison of combined housing plus transportation costs across neighborhoods, to better understand the “true” cost of housing.
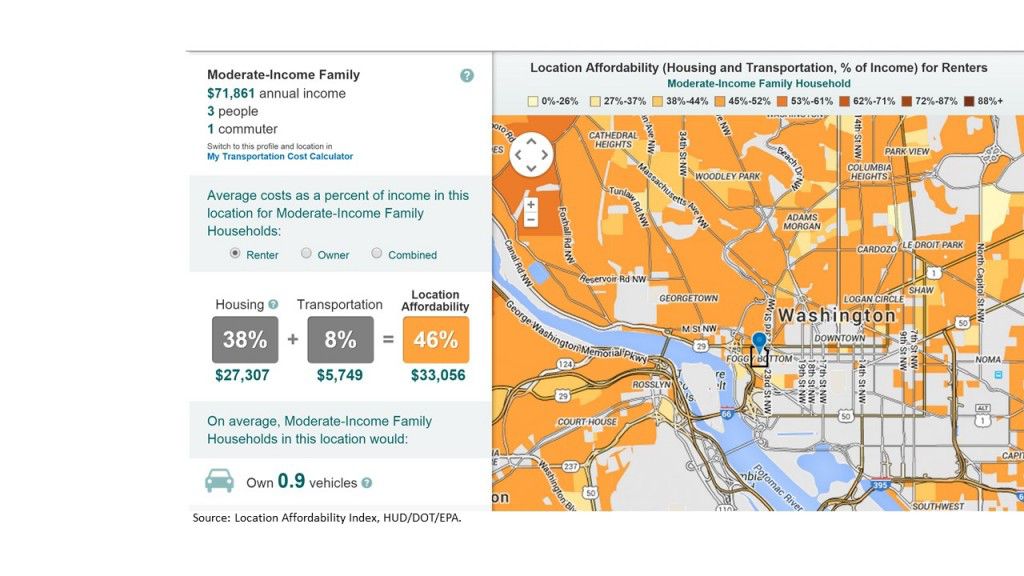
Across the Washington area, neighborhoods that seem more affordable because of lower home prices and rents can actually have higher combined housing plus transportation costs compared to closer-in locations with higher housing costs. For example, a neighborhood like Foggy Bottom in DC, where rents are high, provides a benefit of lower transportation costs to households because of its central location and transit access.
A moderate-income 3-person family that rents and has an income of $71,861 spends a total of 46 percent of its income on housing plus transportation costs, on average, in the Foggy Bottom neighborhood. Housing alone accounts for 38 percent of the household’s income—a share higher than the standard affordability threshold. However, according to the LAI the average renting household in Foggy Bottom spends just eight percent of its income on transportation costs.
Fairfax
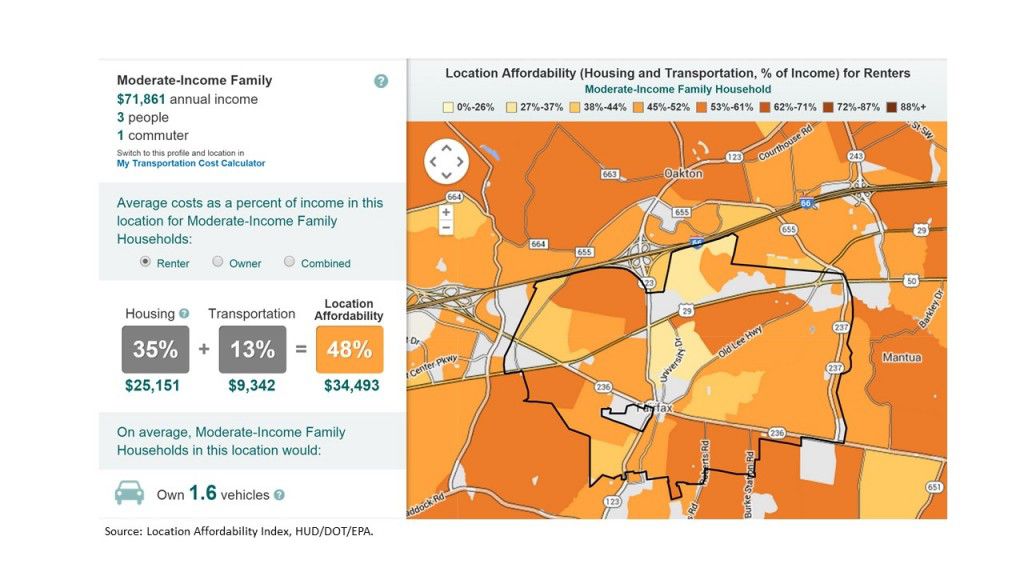
By contrast, the same household would spend 35 percent of its income on rent on average in the city of Fairfax but would have to dedicate 13 percent of its monthly income on transportation costs. So, the cost savings on the housing side in Fairfax is lost to increased spending on transportation.
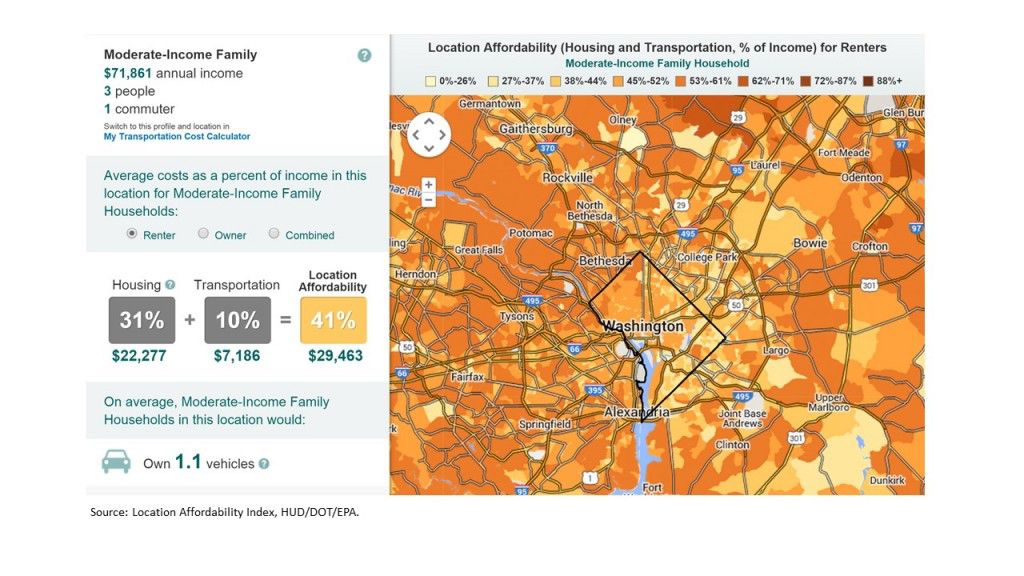
Looking at a regional map of combined housing and transportation costs for this moderate-income renting family shows wide variation in costs. However, costs are often lower in closer-in locations and in suburban locations near transit and jobs. While cost is a major factor in where people live, it is, of course, not the only factor. Neighborhoods with lower transportation costs tend to be higher density neighborhoods with smaller homes and more townhouses and multi-family buildings. Many suburban neighborhoods with higher transportation costs can offer larger housing and more single-family homes. Thus, some households may choose a location with higher costs to find the type of housing they want.
DC Region
However, increasing the availability of housing where households can reduce their combined housing plus transportationcosts can be a tremendous benefit to lower-income households in the region. Affordable housing close to transit is particularly important since lower-income workers are more likely than higher-income workers to commute by transit. Research has found that many jobs are out of reach of these workers because they are not accessible by transit.
Policies to Help Reduce the Combined Housing Plus Transportation Costs in the Washington DC Region
 Housing, transportation and workforce development policies should be coordinated to expand and preserve affordable options for low- and moderate-income workers and their families. Many jurisdictions across the region already have policies in place that encourage the development of housing in transit- and job-accessible locations. But a more coordinated effort across the region would improve the supply of housing and help stem the rise in the combined costs of housing and transportation:
- Create expanded housing options near existing transit through zoning changes and affordability requirements. Location jurisdictions have control over land use and zoning policies and can use these policies to incentivize the production of more housing near transit. Trading increased density for more affordable housing can increase the amount of transit-accessible housing with no direct financial contribution from the jurisdiction.
- Preserve existing affordable housing near planned, future transit. When plans are developed for new transit, local jurisdictions should identify nearby existing affordable housing—both subsidized and non-subsidized housing—and look for ways to preserve it before property values rise. Jurisdictions can do more to work with private and non-profit property owners to purchase properties to maintain long-term affordability or to develop policies—such as tax abatements or exemptions—to incentivize the maintenance of below-market rents.
- Connect economic development and housing planning efforts to create sufficient housing for a growing workforce. As the region grows and diversifies, there will be a growing need for more housing affordable to households with moderate incomes. To remain competitive in the global economy and to be able to attract a diverse and skilled workforce, the Washington DC region must focus on quality of life and cost of living issues. A sufficient supply of housing—that is affordable to workers when they combine their housing plus transportation costs—should be an essential part of a larger regional economic development strategy.
Next month: A Mid-Year Review of the Washington DC Area Housing Market



Thank you for this excellent article and synthesis of research. I have not looked at all the sources but would think the housing-transportation costs are even higher in Prince William and Stafford. Fairfax City actually has a fairly high proportion of residents working either in the town or in Fairfax County, which I would think keeps commuting costs a bit lower.
My only quibble is with the use of vehicle traffic congestion and hours of person delay statistics as a proxy for commuting costs. As you note throughout the article, the problem is with the lack of transportation choices and transit options, which force many households to buy more vehicles and causes a huge uptick in transportation costs. Hours of traffic delay only measure vehicular traffic. A region’s ability to effectively move its people and provide access to jobs and service shouldn’t only be measured by vehicle traffic metrics.
You raise good points. One of the problems with the Locational Affordability data is how transportation costs are calculated. Data on average transportation costs for different household types are generating from a modeling process. Given characteristics of the population, the model estimates total vehicle miles traveled as well as transit use. Details on the methodology can be found here. This modeling process takes into account characteristics of the place (e.g. housing density, employment density) as well as characteristics of the population and housing stock (e.g. renter/owner, household size). So it takes into account more than just vehicle travel and congestion. But it is a model and it’s spitting out an average for all households of a certain type in the city or neighborhood. And of course averages aren’t right for any one particular household.
The city of Fairfax wasn’t selected for any particular reason, except that it’s a well-defined place that people know. (Choose Prince William County is a little trickier because it is so big, but people may be less familiar with particular neighborhoods in Prince William County.) So you’re right that there are many other places in the Northern Virginia area with higher housing plus transportation costs. For the median income family, the combined housing plus transportation cost in the city of Fairfax is $42,218, or 47% of the household’s income. In Stafford County, the H+T costs are 49% of household income and in Manassas and Prince William County the combined H+T costs are 45% of the average household’s income. (You can look up the H+T costs for counties, cities and neighborhoods here.)